
Getting OWASP ZAP to run an unauthenticated scan is straightforward. Getting it to run an authenticated scan against a modern web application, inside a Docker container, on a schedule, with results piped to Slack is where most people give up.
The hard part isn't the scanning. It's the authentication. Modern apps have multi-step login flows, CSRF tokens, OAuth redirects, and session management that breaks the moment you try to automate it. This post walks through the full process: configuring ZAP in the GUI, scripting authentication with Mozilla Zest, containerizing it with Docker, and building a Slack reporting pipeline.
Start with the GUI
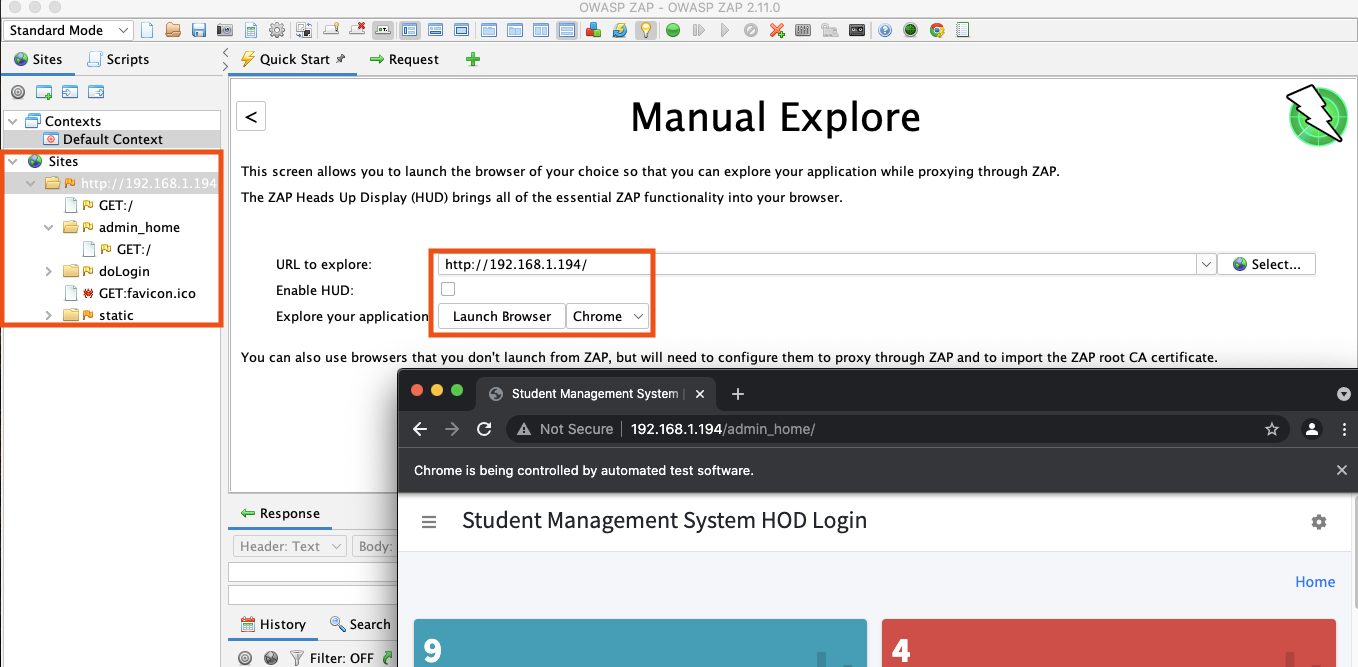
While the goal is full automation, the GUI is where you should start. Configure and test everything interactively first, then export the configuration for CLI use. When the containerized scan inevitably breaks, the GUI is how you debug it. Running the same configuration in both environments and comparing results is the fastest way to isolate what went wrong.
Contexts
ZAP stores application-specific configuration in a "context": URL scope, authentication method, session management, user credentials, technology stack, and scan settings. You configure the context once in the GUI, export it as an XML file, and pass it to the CLI or Docker container.
To create a context, right-click the target URL in the Sites tree and select Include in Context -> New Context. Three settings worth configuring upfront:
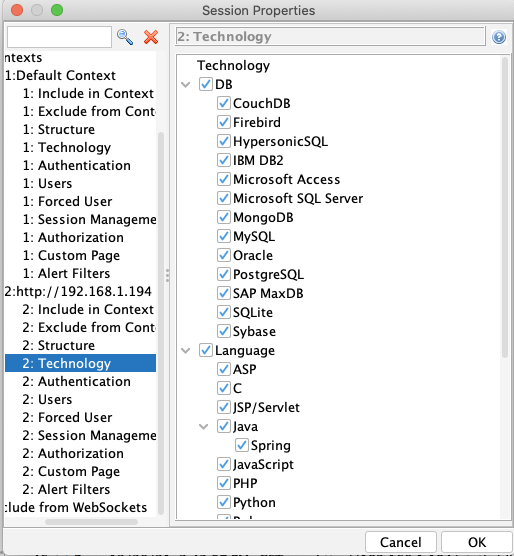
Technology. Disable checks for languages, databases, and web servers your application doesn't use. If you're scanning a Django app on PostgreSQL, there's no reason to run SQL Server or ASP.NET checks. This reduces scan time and noise.
Session Management. ZAP needs to know how your application maintains sessions so it can stay authenticated during the scan. For cookie-based sessions, select Cookie-based Session Management and ZAP will automatically include the session cookie in every request.
Authorization Detection. Tell ZAP how to recognize an unauthorized response. This can be an HTTP status code (403) or a regex pattern in the response body. ZAP uses this to detect when authentication has dropped and re-authenticate.
Authentication with Mozilla Zest
ZAP includes built-in form-based and JSON-based authentication methods. For applications with a simple login form, these work fine. For anything more complex (multi-step flows, CSRF tokens in the login form, JavaScript-rendered login pages, OAuth redirects), you'll need a Zest script.
Mozilla Zest is a JSON-based scripting language designed for recording and replaying HTTP sequences. The workflow:
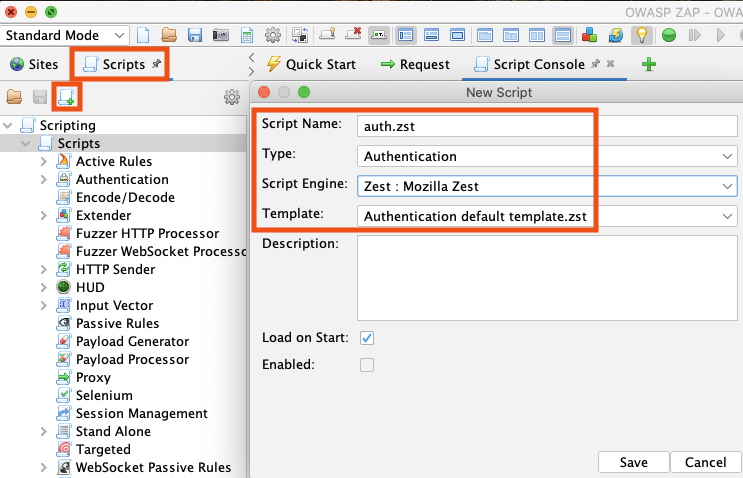
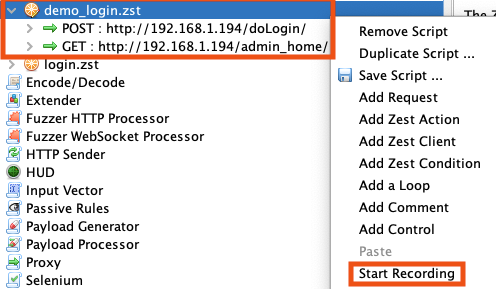
- Create a new Zest authentication script from the Scripts tab
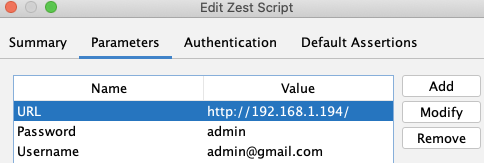
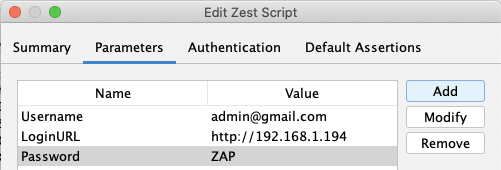
- Parameterize the script so it works with different users and URLs
- Start recording and manually perform the login sequence in ZAP's integrated browser
- ZAP captures every request in the login flow as a Zest step
Test the script using the Run button in the Script Console tab. ZAP checks assertions (response size, HTTP status codes) to verify the login succeeded. If it fails, check whether the application requires a CSRF token that the script isn't capturing, or whether a redirect is happening that the script doesn't follow.
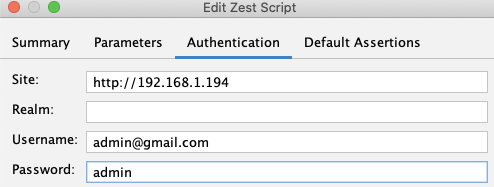
Once the script works, add it to the context as the authentication method:
Two additional settings to configure in the context:
Logged In/Out indicators. Set regex patterns that match content only visible when authenticated (e.g., a "Logout" link) or unauthenticated (e.g., a "Login" button). ZAP uses these to detect dropped sessions during the scan and trigger re-authentication.
Forced User Mode. Enable this (the lock icon in the toolbar) to ensure every request ZAP makes goes through the configured user. Without this, some requests may go out unauthenticated.
Running Scans
With the context and authentication configured, run scans from the GUI to establish a baseline before moving to Docker.
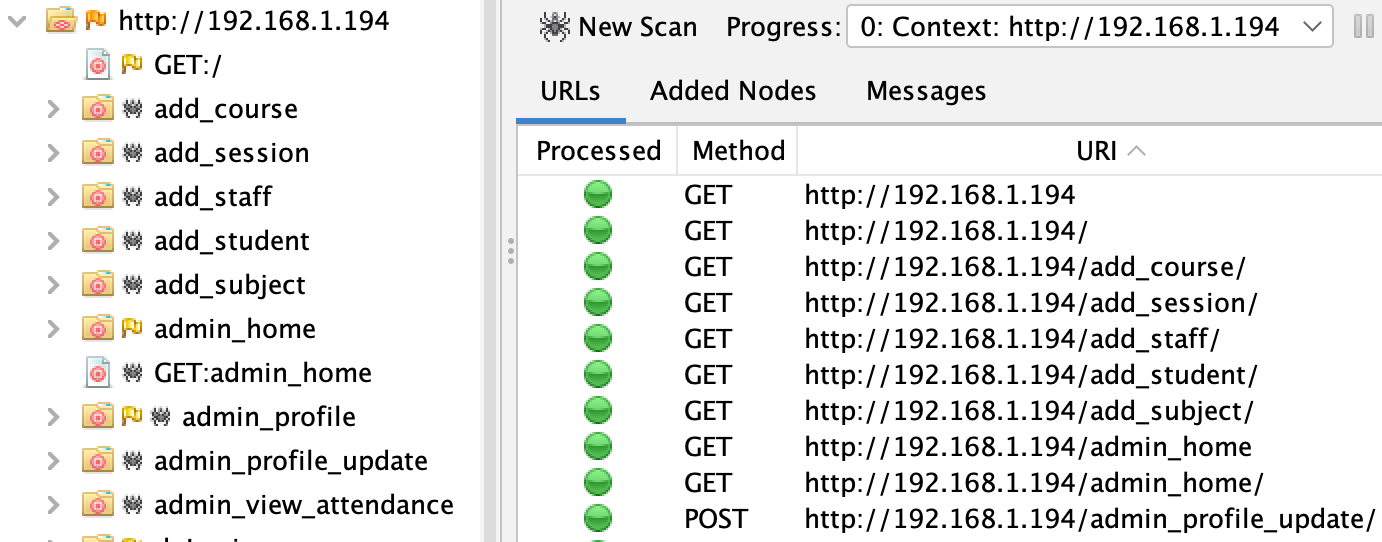
Spider. Right-click the context and run the Spider to crawl the application and discover endpoints. For JavaScript-heavy applications, run the Ajax Spider as well, which uses a real browser to discover dynamically rendered content.
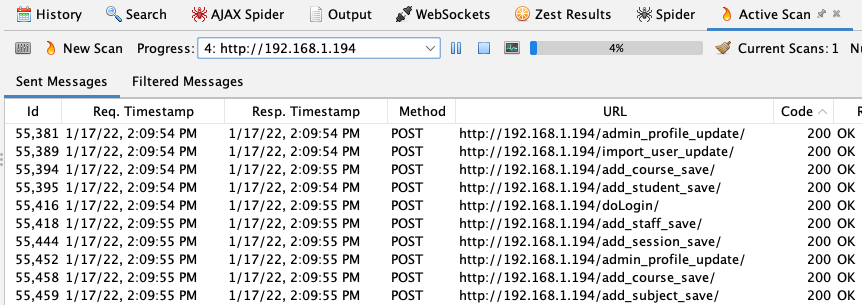
Active Scan. This is the actual DAST vulnerability scan. It sends attack payloads to every discovered endpoint and parameter, then analyzes the responses. For a typical Django application, expect roughly 20 minutes for a full active scan with default settings.
Record the number of URLs discovered and alerts generated. You'll use these as a baseline to verify the Docker scan is working correctly.
Docker Automation
With a working scan in the GUI, export the context file (.context) and the Zest authentication script (.zst). These get mounted into the ZAP Docker container.
ZAP's Docker image includes wrapper scripts for common scan types. zap-full-scan.py runs the spider, ajax spider, and active scan in sequence:
docker run -v $(pwd):/zap/wrk/:rw -t owasp/zap2docker-stable zap-full-scan.py \ |
Breaking this down:
| Flag | Purpose |
|---|---|
-v $(pwd):/zap/wrk/:rw |
Mounts the current directory into the container so ZAP can read the context/script and write the report |
-t http://targeturl |
Target URL to scan |
-j |
Runs the Ajax Spider in addition to the traditional spider |
-d |
Enables debug output (essential for troubleshooting) |
-n demo.context |
Loads the exported context file |
-U admin |
The user to authenticate as (must exist in the context) |
-z "..." |
Passes additional ZAP CLI options, in this case loading the Zest auth script |
-J zap_results.json |
Writes results as JSON |
To load multiple scripts, increment the index: script.scripts(0) for the first, script.scripts(1) for the second.
Slack Reporting
ZAP outputs reports in HTML, Markdown, and JSON. For a scan running on a schedule, a Slack notification with a summary of findings is more useful than a full report that nobody opens.
This script parses the JSON output and sends a color-coded summary to a Slack webhook:
import json |
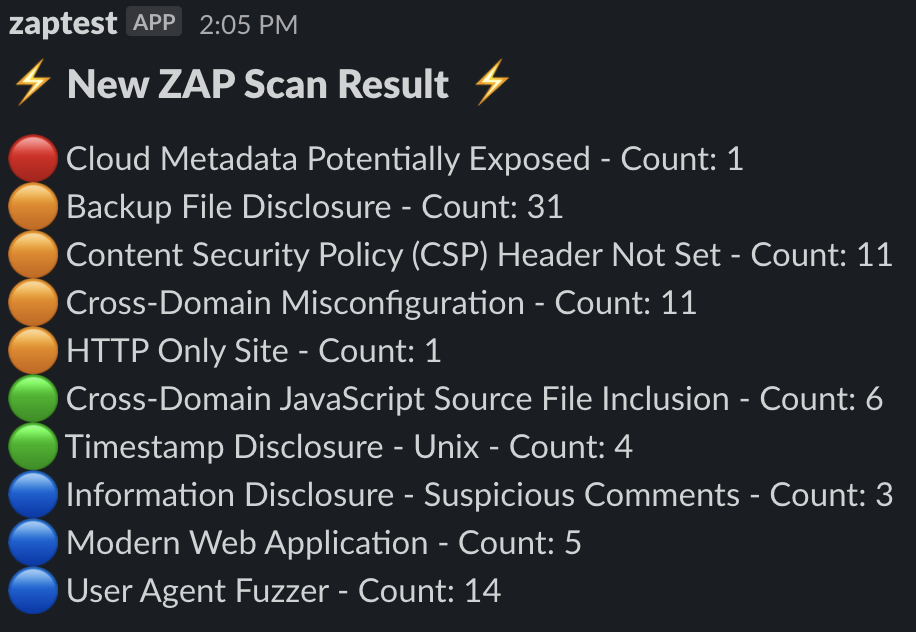
Red for high, orange for medium, green for low, blue for informational. Over time, the value isn't any single scan result. It's watching the findings change between scans: a new red finding means something regressed, a finding disappearing means a fix was deployed.
Troubleshooting
Containerized ZAP scans fail silently more often than they fail loudly. The scan completes, produces a report, but the report is missing findings because authentication broke halfway through or the spider didn't discover half the endpoints. Always run with -d and compare against your GUI baseline.
Authentication dropping mid-scan. The most common issue. The active scan takes 20+ minutes, and if the session expires faster than ZAP re-authenticates, you're scanning unauthenticated pages for most of the run. Check your web server logs for 401/403 responses during the scan. If you see a wall of them partway through, the session expired and the Logged In/Out indicators aren't triggering re-authentication correctly. Tighten the regex patterns.
Low endpoint count. Compare the number of URLs the Docker spider discovers against the GUI spider baseline. If the Docker run finds significantly fewer endpoints, the spider is likely hitting unauthenticated pages and can't follow links that require a session. This cascades into fewer findings in the active scan.
Zest script failing in the container. The script worked in the GUI but fails in Docker. Common causes: the target URL is different (localhost vs. container networking), the context file references a user that isn't configured, or the .zst file path in the -z config doesn't match the mount point. Debug by checking if the first few requests in the scan are authenticated (look for your user's session cookie in the debug output).
Limitations
ZAP is a good general-purpose DAST scanner, but it's worth being honest about what it's not good at:
Single-page applications. The traditional spider follows HTML links. SPAs render content with JavaScript, which the spider can't parse. The Ajax Spider handles this better by using a real browser, but it's slower and still misses dynamically loaded routes that require specific user interactions. If your application is a React or Angular SPA, expect the spider to miss endpoints.
Scan noise. The default active scan generates a lot of informational and low-severity findings (missing headers, cookie flags, server version disclosure). These are real observations but they drown out the findings that matter. Tuning the scan policy to focus on high-value checks and filtering the report output saves time on triage.
Complex authorization. ZAP handles authentication (proving who you are) better than authorization (what you're allowed to do). It won't detect IDOR vulnerabilities or broken access controls unless you write custom scripts to test specific authorization logic. For authorization testing, manual review or a tool built for that purpose is more effective.
DAST is one layer of an application security testing program. It catches the surface-level issues that a scanner can detect from the outside: missing security headers, reflected XSS, basic injection flaws. It doesn't replace source code review, manual penetration testing, or SAST. But automated and running on a schedule, it's an early warning system that catches regressions before they ship.